Dive into the fundamentals and real-world applications of Poisson distribution
In statistics, the Poisson distribution is a pivotal concept renowned for its wide-ranging applications across diverse fields. This comprehensive guide will explore the Poisson distribution, its mathematical foundation, practical applications, and its significance in real-world data analysis.

Introduction to Poisson distribution
Overview of Poisson distribution
The Poisson discrete probability distribution calculates the probability of a specific number of events happening within a set time or space. These events must transpire with a known constant mean frequency independent of the temporal duration since the previous occurrence.
Significance and applications
The Poisson distribution is vital in business, economics, engineering, and various sciences. It is beneficial for modelling random events over a given interval, like the number of emails received per hour or radioactive decay per second.
Key concepts and terminology
Key concepts include:
Rate parameter (λ – lambda): The average number of events in the interval.
Probability mass function: Used to calculate the probability of a given number of events occurring.
Understanding Poisson distribution: definition and meaning
In plain English, the Poisson distribution tells us how likely it is for a certain number of things to happen in a given amount of time or space. These events occur at a consistently known mean rate and are independent of the elapsed time since the previous event.
Real-world scenarios
Examples of its application include predicting the number of calls received at a call centre in an hour, the number of customer arrivals at a store, or the number of typos per page in a book.
Key characteristics and parameters
Notable characteristics of the Poisson distribution include:
- Parameter λ: Represents the mean number of occurrences in the interval.
- Memoryless property: The probability of an event occurring in any given interval is independent of previous intervals.
Understanding Poisson distribution
The Poisson distribution is a powerful statistical tool used to estimate the probability of a given event occurring a certain number of times within a fixed interval. It is particularly useful when dealing with events that are random and independently distributed over time or space.
For example, if a fast-food restaurant typically serves an average of 200 cheeseburgers on a Friday night, the Poisson distribution can help predict the probability of more than 300 people purchasing burgers on a given night. This insight allows managers to make data-driven decisions, such as scheduling staff more effectively or managing inventory to avoid shortages.
The practical applications of the Poisson distribution extend well beyond restaurants. Historically, it was famously used to estimate the annual number of Prussian cavalry soldiers fatally injured by horse-kicks.
Today, the distribution continues to find applications in diverse fields. In urban planning, it helps estimate the number of car accidents in cities of varying sizes. In physiology, it models the frequency of neurotransmitter releases, offering insights into neural communication.
Mathematical foundation of poisson distribution
Formula and mathematical representation
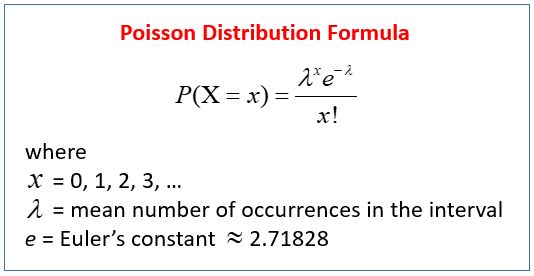
The formula gives the Poisson distribution:
P(X=k)=e−λλkk!P(X=k) = \frac{e^{-\lambda} \lambda^k}{k!}P(X=k)=k!e−λλk
Where:
- P(X=k)P(X=k)P(X=k) is the probability of events in the interval,
- λ\lambdaλ is the average number of events,
- it is the base of the natural logarithm (approximately 2.71828),
- K is the number of occurrences.
Explanation of the parameters (λ – lambda)
Lambda (λ) is the rate parameter indicating the average number of events in a specified interval. It is crucial for calculating the probability of a certain number of events within that interval.
Poisson distribution formula: detailed explanation
Step-by-step breakdown of the formula
Understanding each component of the formula:
- e−λe^{-\lambda}e−λ represents the probability of zero occurrences,
- λk\lambda^kλk gives the weighted likelihood of an occurrence,
- k!k!k! (k factorial) normalises the distribution for all possible occurrences.
Example calculation
For instance, with λ=4\lambda = 4λ=4 (average rate of 4 events per interval) and wanting to find the probability of precisely two events (k=2k = 2k=2): P(X=2)=e−4⋅422!=0.0183⋅162=0.1465P(X=2) = \frac{e^{-4} \cdot 4^2}{2!} = \frac{0.0183 \cdot 16}{2} = 0.1465P(X=2)=2!e−4⋅42=20.0183⋅16=0.1465
Applications of poisson distribution in different fields
Use in business and economics
In business and economics, Poisson distribution models events like the number of customers arriving at a service point, inventory demands, or loan defaults.
Use in scientific and engineering contexts.
In scientific and engineering fields, it applies to phenomena such as radioactive decay, particle detection, and defect occurrences in manufacturing processes.
Poisson distribution vs. other distributions
Comparison with binomial distribution
Poisson distribution differs from binomial distribution mainly because it deals with the number of events in a fixed interval, not a fixed number of trials. Binomial distribution requires several separate tries and a steady chance of getting it right, while Poisson distribution requires a constant mean rate of occurrence and independence over time.
When to use Poisson distribution
The Poisson distribution is beneficial for rare events over a considerable interval, where the event probability is small but the number of trials is large. Compared to the binomial distribution, it simplifies analysis, especially when the number of trials is unknown or undefined.
Properties of Poisson distribution
Fundamental properties and their implications
Key properties include:
The Poisson distribution has several distinctive properties that make it especially useful for modeling random events over time or space.
- Mean and Variance: In a Poisson distribution, both the mean and the variance are equal to the parameter λ\lambdaλ, which represents the average rate of occurrence of the event within a given interval.
- Additivity: A remarkable feature of the Poisson distribution is its additivity. When two independent variables are each Poisson-distributed, their sum also follows a Poisson distribution. The parameter of the combined distribution is simply the sum of the individual parameters.
- Memorylessness: The Poisson distribution has a property of memorylessness, meaning the probability of an event occurring in the next interval is independent of the events in previous intervals.
Examples illustrating these properties
For instance, if the average number of emails received per hour is 5 (λ=5\lambda = 5λ=5), then both the mean and the variance of the distribution are 5. If two departments receive emails independently with averages of 3 and 4 per hour, the combined email rate for the entire office is Poisson-distributed with λ=7\lambda = 7λ=7.
Assumptions of poisson distribution
Detailed list of assumptions
The Poisson distribution is based on several assumptions:
- Events are independent.
- The average rate (λ) is constant.
- Two events cannot co-occur.
- The probability of more than one event in a tiny interval is negligible.
Impact of deviations from assumptions
Departures from these suppositions may result in imprecisions. For example, if events are not independent or if λ is not constant, the calculated probabilities may not accurately reflect real-world scenarios, leading to potential misinterpretations.
Calculating probabilities with Poisson distribution
Methods and tools for calculation
Probabilities can be calculated manually using the Poisson formula or with statistical software and tools like R, Python, or specialized calculators like Stats Direct.
Example of probability calculations
Consider λ=3\lambda = 3λ=3 for the number of customers arriving per hour. To find the probability of precisely five customers arriving in an hour: P(X=5)=e−3⋅355!=0.0498⋅243120=0.1008P(X=5) = \frac{e^{-3} \cdot three ^5}{5!} = \frac{0.0498 \cdot 243}{120} = 0.1008P(X=5)=5!e−3⋅35=1200.0498⋅243=0.1008
Poisson distribution in business and industry

Case studies and practical applications
Poisson distribution is a handy tool for modelling different business processes. It helps us determine the demand for products in supply chain management, the number of calls a call center might receive, and even when machines might break down so we can schedule maintenance.
Benefits and limitations
Benefits include simplicity and accurate modelling of random events. Limitations arise if the assumptions do not hold, such as when events are dependent, or the rate parameter is not constant.
Graphical representation of Poisson distribution
How to graph Poisson distribution
Graphing a Poisson distribution involves plotting the probabilities of different numbers of events. This is typically done using software tools like R or Python, which offer built-in functions for generating Poisson distribution plots.
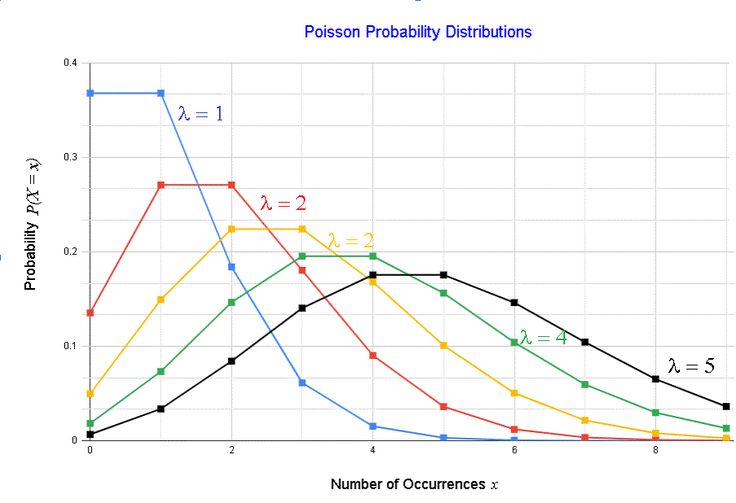
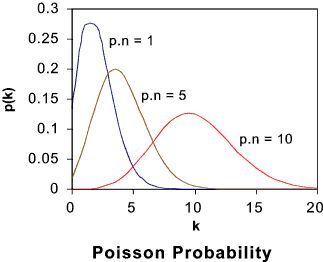
Interpretation of graphical results
Interpreting the graph involves understanding the distribution’s shape. It typically peaks at the mean (λ) and tapers towards higher numbers of events. The spread of the distribution depends on the value of λ; larger λ values result in a wider spread.
Using Poisson distribution in statistical software
Implementing Poisson distribution in software tools
Statistical software tools like R Python (with libraries like SciPy and NumPy) and specialized software like Stats Direct offer functionalities for implementing and analyzing Poisson distributions. These tools can generate random samples, calculate probabilities, and visualize the distribution.
Poisson distribution in real-world data analysis
Case studies and practical examples
Applications include analyzing traffic flow, modelling bus arrival times, and studying the frequency of disease outbreaks. Each application requires careful consideration of assumptions and proper implementation of the Poisson model.
Interpretation of real-world data
Interpreting real-world data with the Poisson distribution involves fitting the data to the model and validating assumptions. This helps to make informed decisions based on predicted probabilities and observed frequencies.
Common misconceptions about Poisson distribution
Addressing frequent misunderstandings
Misconceptions include believing the Poisson distribution can handle dependent events or applies to all rare events. Clarifying these points ensures accurate application and analysis.
Clarifications based on expert sources
Experts emphasize that the Poisson distribution is best for modelling rare, independent events over a fixed interval. Misapplying the distribution can lead to significant errors in probability estimation and decision-making.
Advanced topics in Poisson distribution
Extensions and generalizations
In more complicated scenarios, we have the compound Poisson distribution. Here, the number of events follows a Poisson distribution, but each follows a different distribution. Another extension is the non-homogeneous Poisson process, where the rate parameter λ varies over time.
Related distributions and their properties
Related distributions include the negative binomial distribution, which generalizes the Poisson distribution to account for over-dispersion, where the variance exceeds the mean. Understanding these related distributions helps in selecting the appropriate model for complex scenarios.
Practical exercises and examples
Step-by-step exercises for better understanding
To solidify understanding, practical exercises include calculating the probability of different numbers of events using the Poisson formula, plotting Poisson distributions with varying λ values, and applying the distribution to real-world data sets.
Solutions and explanations
Providing detailed solutions and explanations for these exercises reinforces concepts and demonstrates the practical utility of the Poisson distribution.
Further reading and resources
Recommended resources for in-depth study
For further exploration, recommended resources include textbooks like “Introduction to Probability Models” by Sheldon Ross and online courses covering probability and statistical modelling.
List of useful tools and references
Useful tools include statistical software like R, Python, and Stats Direct, offering robust functionalities for implementing Poisson distributions. Additionally, websites like Scriber and Stats Direct provide valuable tutorials and examples.
FAQs
What is the Poisson distribution, and why is it important?
The Poisson distribution determines how likely a certain number of things will happen over time or in a particular space. It’s essential for modelling and analyzing random, independent events at a constant average rate.
How does the Poisson distribution differ from the binomial distribution?
The Poisson distribution deals with events occurring in a fixed interval with a constant mean rate, whereas the binomial distribution applies to a fixed number of independent trials with two possible outcomes.
What are some real-world applications of the Poisson distribution?
Applications include predicting customer arrivals at a store, modelling call center operations, analyzing traffic flow, and studying the frequency of rare events like disease outbreaks or equipment failures.
What are the critical assumptions of the poisson distribution?
Key assumptions include event independence, a constant average rate (λ), no simultaneous events, and negligible probability of more than one event in a tiny interval. Deviations can affect the distribution’s accuracy.
How can I calculate probabilities using the poisson distribution?
Use the formula P(X=k)=e−λλkk! P(X=k) = \frac{e^{-\lambda} \lambda^k}{k!}P(X=k)=k! e−λλk or statistical software tools like R and Python, which offer built-in functions for efficient calculations.


