How regression helps in business and finance
Struggling to make sense of complex business data and financial trends? Regression analysis might be the key you’re looking for! This statistical method helps find relationships between variables & helps predict future outcomes based on past data. Whether you’re trying to forecast sales, understand customer behavior, or make better financial decisions, regression analysis provides a solid foundation.

What is regression?
Regression is a statistical method used to study the relationship between two or more variables. It helps us see how the typical value of one variable (the dependent variable) changes when another variable (the independent variable) changes, while keeping other variables constant.
History of regression
The earliest form of regression, known as the method of least squares, was developed by Adrien-Marie Legendre in 1805 and further refined by Carl Friedrich Gauss in 1809.
Both applied this method to determine the orbits of celestial bodies around the Sun, initially focusing on comets and later on newly discovered minor planets. Gauss expanded on the theory in 1821, laying the groundwork for the Gauss-Markov theorem.
The term “regression” was introduced by Francis Galton in the 19th century to describe how the heights of descendants of tall ancestors tended to move closer to an average, a phenomenon now known as “regression toward the mean.”
In the 1950s and 1960s, economists began using electromechanical calculators to perform regression analyses, which could take up to 24 hours to complete a single calculation.
Today, regression remains a dynamic field of research, with recent advancements in robust regression, handling correlated responses such as time series, and accommodating complex data structures like images and graphs.
Understanding regression
Regression is a statistical tool that captures relationships between variables in a data set and assesses the statistical significance of these relationships. By analyzing these correlations, regression provides insights into how changes in one variable may influence another, which is especially useful in predictive analysis and forecasting.
The two fundamental types of regression are simple linear regression and multiple linear regression, though nonlinear regression techniques are also available for complex data sets.
Simple linear regression uses a single independent variable to predict or explain the outcome of a dependent variable, while multiple linear regression incorporates two or more independent variables to predict the same dependent variable.
Regression plays a valuable role in finance and investment, where it aids in making data-driven decisions.
Explanation of regression equation and components

The regression equation shows this relationship mathematically. For simple linear regression, the equation looks like this: Y=a+bX+ε. Here’s what each part means:
- Y is the dependent variable we want to predict.
- X is the independent variable we use for prediction.
- a is the intercept, or the starting value of Y when X is zero.
- b is the slope, showing how much Y changes when X increases by one unit.
- ε is the error term, representing the difference between the actual and predicted values of Y.
Importance of regression in analyzing data
These components are important because they help us understand the results of regression analysis. In business and finance, regression analysis is very useful. It lets us study trends, make forecasts, and test ideas about how different variables are related. This leads to better, more informed decisions.
Types of regression analysis
Simple linear regression
Simple linear regression is the most basic form of regression analysis. It looks at the relationship between two variables: one independent variable and one dependent variable.

For example, a company might use simple linear regression to predict future sales (the dependent variable) based on advertising spending (the independent variable). The goal is to find a straight line that best fits the data points.
Multiple regression
Multiple regression is used when we want to predict a dependent variable based on more than one independent variable. This type of regression can handle more complex relationships.
For instance, a business might use multiple regression to predict sales based on advertising spending, pricing, and seasonal factors. By considering multiple variables, we get a more accurate and detailed understanding of the factors influencing the dependent variable.
Logistic regression
Logistic regression is used when the dependent variable is categorical, such as yes/no or success/failure. Unlike linear regression, which predicts a continuous outcome, logistic regression predicts the probability of a particular outcome.

Businesses often use logistic regression for tasks like customer classification, predicting whether a customer will buy a product, or assessing the risk of loan defaults. It’s a powerful tool for making predictions when dealing with categorical data.
How regression analysis works
Data collection and preparation
The first step in regression analysis is to collect and prepare the data. This involves gathering relevant data and ensuring it is clean and accurate. Missing values need to be addressed, and any outliers should be carefully examined.
Choosing the right model
Next, choose the appropriate regression model based on the type of data and the relationship you want to analyze. This could be simple linear regression, multiple regression, or logistic regression.
Running the analysis
Once the data is ready and the model is chosen, the analysis can be run. This involves using statistical software to calculate the regression equation and coefficients.
Interpreting results
After running the analysis, it’s important to interpret the results correctly. Look at the regression coefficients to understand the impact of each independent variable on the dependent variable. Check the p-values to see if the results are statistically significant.
Concept of the best fit line
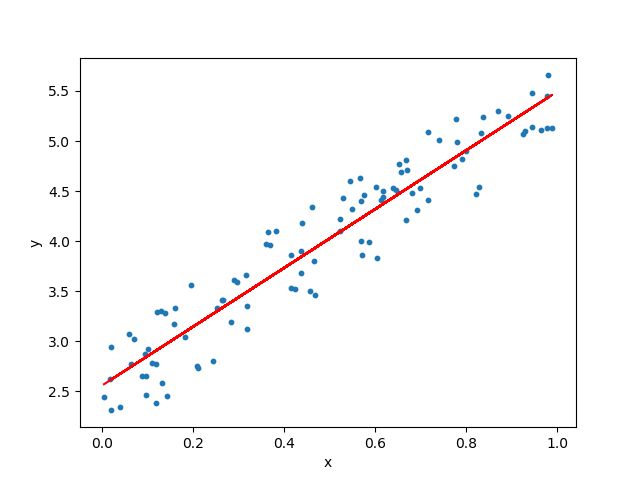
In simple linear regression, the best fit line is the straight line that minimizes the distance between itself and all the data points. This line shows the average relationship between the variables.
Importance of independent and dependent variables
Independent variables are the predictors or factors we think will influence the outcome. The dependent variable is what we’re trying to predict. Understanding the role of each type of variable helps in setting up the regression model correctly and interpreting the results accurately.
Applications of regression in business

Forecasting sales and revenues
Businesses often use regression analysis to predict future sales and revenues. By analyzing past sales data and identifying patterns, companies can forecast future performance. This helps in budgeting, inventory management, and strategic planning. For example, a retailer might use historical sales data and promotional activity as variables to forecast future sales.
Analyzing customer behavior
Regression analysis helps businesses understand customer behavior. By examining variables such as purchase history, demographics, and browsing patterns, companies can predict future customer actions.
This is essential for targeted marketing campaigns and improving customer retention. For instance, an e-commerce company might use regression to predict which customers are likely to make repeat purchases.
Optimizing business processes
Businesses can also use regression analysis to optimize their processes. By studying various factors that affect efficiency and productivity, companies can make data-driven improvements. For example, a manufacturing firm might use regression analysis to identify factors that influence production times and find ways to streamline operations.
Real-world examples of regression in business decision-making
Regression analysis has numerous real-world applications in business. For example, a restaurant chain might use regression to determine the impact of menu changes on sales.
Similarly, a hotel might analyze the relationship between room rates and occupancy levels to optimize pricing strategies. These examples show how regression analysis helps businesses make informed decisions that enhance performance and profitability.
Applications of regression in finance
Predicting stock prices and returns
In finance, regression analysis is commonly used to predict stock prices and returns. By analyzing historical price data and market indicators, investors can identify trends and make informed investment decisions.
For example, regression can help forecast how a stock might perform based on economic indicators like interest rates and GDP growth.
Risk management and portfolio optimization
Regression analysis is vital for risk management and portfolio optimization. Financial analysts use it to assess the risk associated with different assets and to optimize the mix of investments in a portfolio.
By understanding the relationship between various financial instruments, analysts can minimize risk and maximize returns.
Valuation of financial instruments
Regression analysis helps in valuing financial instruments, such as bonds and derivatives. By analyzing factors like interest rates, credit ratings, and market conditions, regression models can estimate the fair value of these instruments. This is crucial for making investment decisions and managing financial portfolios.
Real-world examples of regression in finance
In finance, real-world applications of regression analysis include predicting bond prices based on interest rate movements, assessing the impact of economic indicators on stock performance, and evaluating the risk of loan defaults. These examples illustrate how regression analysis provides valuable insights that guide financial strategies and decision-making.
Benefits of regression analysis
Advantages in decision-making and strategic planning
Regression analysis offers significant advantages in decision-making and strategic planning. It helps businesses and financial institutions make data-driven decisions that are more accurate and reliable.
Enhanced understanding of data relationships
By using regression analysis, organizations can gain a deeper understanding of the relationships between different variables. This helps in identifying key factors that influence outcomes and in developing effective strategies.
Improved forecasting accuracy
Regression analysis improves forecasting accuracy by providing a mathematical basis for predictions. This leads to better planning and resource allocation, ultimately enhancing overall performance and efficiency.
Challenges and limitations of regression analysis
Issues with overfitting and model selection
One major challenge in regression analysis is overfitting, which happens when the model is too complex and captures noise in the data instead of the actual relationship. This leads to poor predictive performance on new data. Choosing the right model is crucial to avoid this issue. Simple models may miss important relationships, while complex ones may overfit.
Data quality and availability concerns
The accuracy of regression analysis depends heavily on the quality and availability of data. Incomplete, inaccurate, or biased data can lead to incorrect conclusions. Ensuring high-quality data collection and preparation is essential for reliable results.
Understanding and addressing assumptions
Regression analysis relies on several assumptions, such as linearity, independence, and homoscedasticity. If these assumptions are violated, the results may not be valid.
It’s important to understand these assumptions and take steps to address any violations, such as transforming variables or using different modeling techniques.
Situations where regression may not be effective
Regression analysis is not always the best tool for every situation. For example, in cases where relationships between variables are highly nonlinear or involve complex interactions, other techniques like machine learning might be more appropriate.
Recognizing the limitations of regression and knowing when to use alternative methods is crucial for effective analysis.
Key takeaways
Regression analysis is a powerful tool in business and finance for understanding relationships between variables, forecasting, and decision-making. While it has many benefits, it’s important to be aware of its limitations and ensure high-quality data and appropriate model selection. Proper use of regression can greatly enhance strategic planning and operational efficiency.
FAQs
What is an example of a regression in business?
A retail store using past sales data to predict future sales based on advertising spend is an example of regression in business.
What is regression to the mean in business?
Regression to the mean is when extreme values tend to move closer to the average over time. For example, a very successful product launch may be followed by more average sales.
What is the role of regression in business?
Regression helps businesses understand relationships between variables, make forecasts, and improve decision-making based on data analysis.
How do businesses use linear regression?
Businesses use linear regression to predict outcomes, like sales or revenue, based on one or more factors, such as marketing spend or economic conditions.
What companies use regression analysis?
Many companies, including retailers, banks, and tech firms, use regression analysis to forecast trends, understand customer behavior, and optimize operations.


