Navigate uncertainty with this guide to confidence intervals
In statistics, confidence intervals serve as a pivotal concept. They enable researchers to approximate population parameters by leveraging information obtained from sample data. They provide a range of values within which we can expect the proper population parameter to lie with a certain confidence level. This guide will explore definitions, importance, types, calculation methods, practical applications, and common misconceptions surrounding confidence intervals. By the end of this article, you’ll understand how confidence intervals work and how they can be applied in various fields.

Understanding confidence intervals
Explanation of confidence intervals
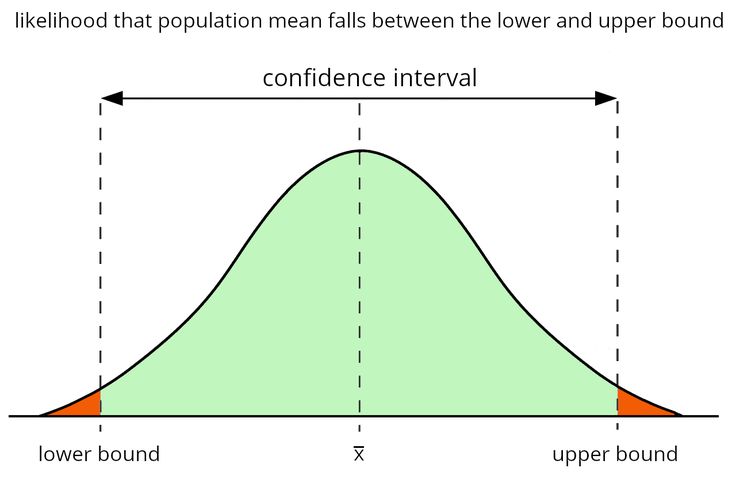
A confidence interval is a range of estimated values based on sample data that is highly likely to encompass the proper population parameter. The method guarantees that a specified portion (known as the confidence level) of the confidence intervals computed from several samples will include the actual population parameter. Confidence intervals are crucial in statistics as they provide insight into a sample estimate’s uncertainty.
Role in predicting population parameters
Confidence intervals serve as tools for making educated guesses about a population’s characteristics based on information gathered from a sample. For example, to estimate the average height of students attending a specific school, we can randomly choose a group of students, measure their heights, and construct a confidence interval using this data. This confidence interval will give us an estimate of the average height of the entire student body.
Key terms: population mean, sample mean, standard error
Population mean (μ): The average of a population parameter.
Sample mean (x̄): The average of a sample drawn from the population.
Standard error (SE): The standard error, the standard deviation of a statistic’s sampling distribution, gauges how precisely or accurately a sample mean represents the population mean.
Types of confidence intervals
Known population variance
When the population variance (σ²) is known, the confidence interval is calculated straightforwardly using the z-distribution. This type of interval is common in situations where the population standard deviation has already been established through previous studies or extensive data collection.
Unknown population variance
When the population variance is unknown, which is often the case, we use the sample variance (s²) and the t-distribution. This type of interval accounts for the additional uncertainty introduced by estimating the population variance from the sample.

Calculation process
Steps for known variance
Identify significance level
The confidence level of an interval is determined by the significance level (α). Commonly used confidence levels are 90%, 95%, and 99%, corresponding to α values of 0.10, 0.05, and 0.01, respectively.
Use z-scores from a normal distribution.
The z-score for a given confidence level can be found in standard normal distribution tables. For instance, a 95% confidence level corresponds to a z-score of approximately 1.96.
Example calculation
If the sample mean (x̄) is 100, the population standard deviation (σ) is 15, and the sample size (n) is 25, the 95% confidence interval is calculated as xˉ±z×σnx̄ ± z × \frac{σ}{\sqrt{n}}xˉ±z×nσ 100±1.96×1525100 ± 1.96 × \frac{15}{\sqrt{25}}100±1.96×2515 100±1.96×3100 ± 1.96 × 3100±1.96×3 100±5.88100 ± 5.88100±5.88 So, the confidence interval is (94.12, 105.88).
Steps for unknown variance
Identify sample size and degrees of freedom.
The degrees of freedom (df) are calculated in a sample by subtracting one from the sample size (n-1). This df value is crucial for identifying the corresponding t-score in the t-distribution table.
Use t-scores from t-distribution
To determine the t-score, you need to know the confidence level and the degrees of freedom. For instance, if you have a sample size of 25 (degrees of freedom = 24) and a 95% confidence level, the t-score is approximately 2.064.
Example calculation
If the sample mean (x̄) is 100, the sample standard deviation (s) is 15, and the sample size (n) is 25, the 95% confidence interval is calculated as: xˉ±tα2×snx̄ ± t_{\frac{α}{2}} × \frac{s}{\sqrt{n}}xˉ±t2α×ns 100±2.064×1525100 ± 2.064 × \frac{15}{\sqrt{25}}100±2.064×2515 100±2.064×3100 ± 2.064 × 3100±2.064×3 100±6.192100 ± 6.192100±6.192 So, the confidence interval is (93.808, 106.192).
Practical applications
Business: predicting returns on investments
In business, confidence intervals are used to predict future returns on investments. For instance, a financial analyst might use historical return data to construct a confidence interval for the expected return on a stock, helping investors make informed decisions.
Medicine: estimating treatment effects
In medical research, confidence intervals are crucial for estimating the effects of treatments. For example, a clinical trial might report that a new drug lowers blood pressure by 5-10 mmHg with 95% confidence. This interval helps doctors understand the potential range of the drug’s effectiveness.
Psychology: analysing survey data
In psychology, researchers use confidence intervals to analyse survey data. For instance, a study on stress levels might report that the average stress score in a population is between 3.5 and 4.5 with 95% confidence, providing a range for interpreting the data.
Advantages and limitations
Benefits
Confidence intervals offer several benefits:
- They provide a range of values rather than a single estimate, which accounts for sampling variability.
- They offer a straightforward way to express the precision of an estimate.
- They are widely applicable in various fields, from business to medicine.
Limitations
Despite their usefulness, confidence intervals have some limitations:
- They assume that the data follows a normal distribution, which might only sometimes be the case.
- The accuracy of the interval depends on the sample size; smaller samples can lead to broader and less precise intervals.
Worked examples
Business application
Scenario description
Imagine a company wants to estimate the average annual return on its stock portfolio. The financial analyst calculates the sample mean and standard deviation using historical data.

Calculation steps
Suppose the sample mean (x̄) is 8%, the sample standard deviation (s) is 2%, and the sample size (n) is 50. The analyst wants to calculate a 95% confidence interval.
Using the t-distribution (df = 49) and a t-score of approximately 2.009, the confidence interval is 8±2.009×2508 ± 2.009 × \frac{2}{\sqrt{50}}8±2.009×50two 8±2.009×0.2838 ± 2.009 × 0.2838±2.009×0.283 8±0.5688 ± 0.5688±0.568 So, the confidence interval is (7.432, 8.568).
Interpretation of results
The company can be 95% confident that the actual average annual return on its portfolio is between 7.432% and 8.568%.
Medical research
Scenario description
A clinical trial is conducted to estimate the effect of a new medication on blood pressure. The sample includes 30 patients, and the reduction in blood pressure is recorded.
Calculation steps
Suppose the sample mean (x̄) reduction is ten mmHg, the sample standard deviation (s) is five mmHg, and the sample size (n) is 30. The researcher wants to calculate a 95% confidence interval.
Using the t-distribution (df = 29) and a t-score of approximately 2.045, the confidence interval is 10±2.045×53010 ± 2.045 × \frac{5}{\sqrt{30}}10±2.045×30five 10±2.045×0.91310 ± 2.045 × 0.91310±2.045×0.913 10±1.86710 ± 1.86710±1.867 So, the confidence interval is (8.133, 11.867).
Interpretation of results
With a 95% confidence level, the medication’s average blood pressure reduction falls between 8.133 and 11.867 mmHg.

Common misconceptions
Misinterpretation of the interval
One common misconception is that the confidence interval represents the sample mean’s range. Based on the sample data, the confidence interval estimates the range within which the proper population parameter lies.
Confusion between confidence level and probability
Another common misconception involves mistaking the confidence level for the likelihood that the actual parameter falls within a specific interval. The confidence level (e.g., 95%) indicates the proportion of times the interval would contain the proper parameter if we repeated the sampling process many times.
Importance of correct interpretation
Correctly interpreting confidence intervals is crucial for making reliable inferences. Misinterpretations can lead to incorrect conclusions and potentially costly decisions. Always remember that the confidence interval provides a range for the population parameter, not the sample statistic.
Encouragement to practice calculations
To master confidence intervals, practice calculating them using different datasets and confidence levels. This will strengthen your comprehension of the idea and improve your use of it in everyday life.
FAQs
What is a confidence interval, and why is it important?
A confidence interval is a range of values that approximate a population parameter based on sample data. It holds significance as it offers an indication of the uncertainty encompassing the estimation, facilitating an understanding of the accuracy and reliability of the sample statistic.
How do confidence intervals change with different sample sizes?
As sample sizes increase, the confidence intervals become narrower, which signifies more accurate estimations of the population parameter. Smaller sample sizes lead to wider intervals, reflecting more significant uncertainty.
What is the difference between a confidence interval and a confidence level?
A confidence interval illustrates a range of values within which the population parameter is likely to be found. The confidence level, on the other hand, indicates the probability that the interval will contain the proper parameter if the sampling process is repeated multiple times.
How would you explain the meaning of a confidence interval of 95%??
A 95% confidence interval means that if we were to take many samples and compute an interval from each, approximately 95% of those intervals would contain the proper population parameter. It reflects a high level of confidence in the estimate.
Can confidence intervals be used for non-normal distributions?
Yes, confidence intervals can be used for non-normal distributions, but the methods for calculating them may differ. Techniques such as bootstrapping or non-parametric methods can be employed to construct confidence intervals for non-normal data.


